| School Value-Added |  |
Understanding the Data
Overview of "Growth" and "Achievement"
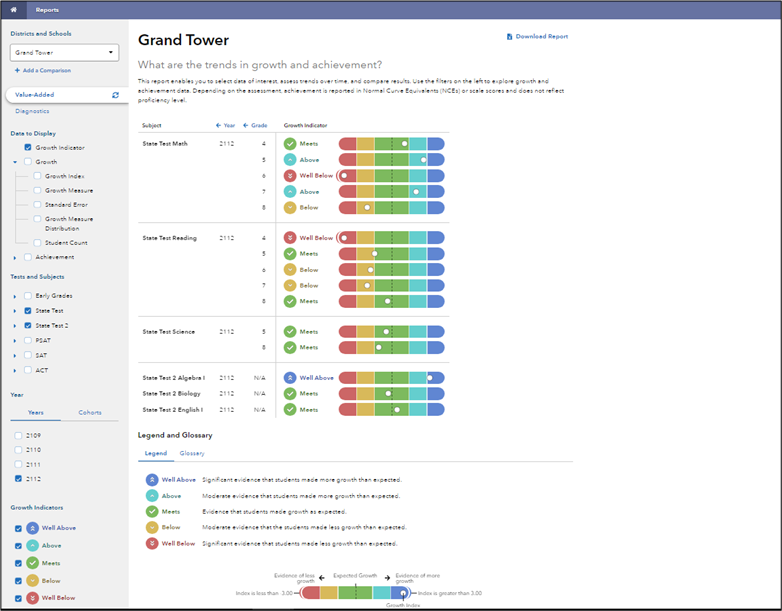
This report enables you to assess trends in growth and achievement in the schools that you have access to.
Growth is the difference between students' entering and exiting achievement. You have two options for how to display growth data, and you can view both at once, if you prefer.
- The effectiveness level is the color-coded bar that plots the growth index in the context of expected growth.
- The columns of Growth data include key metrics related to students' growth, such as the growth measure, its standard error, and the growth index.
Achievement is student performance at a single point in time. Achievement metrics, which are described by columns of achievement data, are helpful when interpreting growth metrics and understanding student learning in context.
Additional information about how these measures are calculated can be found in the Statistical Models and Business Rules. For more information about growth and achievement, see Concept of Growth.
Effectiveness LevelEach growth index is plotted on a color-coded effectiveness level bar to indicate the amount of statistical evidence we have that the School meets, exceeds, or falls short of Expected Growth. Expected GrowthExpected Growth indicates the amount of growth the group of students must make to maintain their entering achievement. For more information, see Understanding Growth.
| Figure: Sample report. The colors might be different in your reports.
|
Definitions of Column Headings
Growth Columns
Use growth data to:
- Make fair comparisons across subjects, grades, courses, and years
- Find areas of strength and areas that need improvement
The table below gives general information about the growth columns and links to more in-depth information.
| Column Name | Glossary Definition | Where to Find More Information |
|---|---|---|
| Growth Index | An indicator of the certainty that the group of students met, exceeded, or fell short of expected growth. | Understanding the Growth Index |
| Effect Size | An indicator of magnitude and practical significance that the group of students met, exceeded, or fell short of expected growth. | Understanding Effect Size |
| Growth Measure | A conservative estimate of the growth that students made, on average, in a grade and subject or course. | Growth Measures And Standard Errors |
| Standard Error | A measurement that establishes a confidence band around the growth measure and describes the certainty that the group of students met, exceeded, or fell short of expected growth. | Growth Measures And Standard Errors |
| Standard Deviation | An indicator of the amount of variation that exists in the student-level distribution of growth. Each distribution is specific to the year and the subject/grade or course. | Understanding Effect Size |
| Student Count | The number of students included in the analysis. | Understanding the Student Count |
Achievement Columns
Use achievement data to:
- Observe shifts in entering achievement for different groups of students over the years
- Identify patterns of effectiveness with students at differing levels of entering achievement
- Support vertical conversations with feeder schools or teachers of prerequisite courses
The table below gives general information about the achievement columns and links to more in-depth information.
| Column Name | Glossary Definition | Where to Find More Information |
|---|---|---|
| Entering Achievement and Exiting Achievement | Depending on the assessment, achievement is reported in Normal Curve Equivalents (NCEs) or scale scores.
| Understanding Entering Achievement and Exiting Achievement |
| Entering Achievement Percentile | The entering achievement for the group of students relative to the overall distribution for this assessment. | Understanding Entering Achievement Percentile |
| Student Count | The number of students included in the analysis. | Understanding the Student Count |
How the Colors Are Assigned
The model generates growth measures and standard errors. You can see rounded versions of these numbers by selecting the Growth Measure and Standard Error columns under Data to Display. We calculate each growth index by dividing the unrounded growth measure by the unrounded standard error. We assign colors to growth indexes based on how far the indexes are from expected growth.
| Color | Growth Index Compared to Expected Growth | Interpretation |
|---|---|---|
| Light Blue | At least 2 standard errors above | Significant evidence that students made more growth than expected. |
| Green | Between 2 standard errors above and 2 standard errors below | Evidence that students made growth as expected. |
| Yellow | More than 2 standard errors below | Significant evidence that students made less growth than expected. |

