Ohio Value-Added

Help

Back
Contact Us
Table of Contents
  • Measuring Growth
    • Concept of Growth
    • Growth Measures and Standard Errors
    • Gain Model
    • Predictive Model
  • Ohio Public
    • Comparison Reports
      • School Search
        • Understanding the Report
        • Interpreting the Data
      • Value-Added School Summary
        • Understanding the Report
        • Interpreting the Data
      • Scatterplots
        • Building a Scatterplot
        • Interpreting the Data
    • District Reports
      • District Value-Added
        • Understanding the Data
          • Growth Columns
          • Achievement Columns
      • Accountability Value-Added
    • School Reports
      • Value-Added
        • Understanding the Data
          • Growth Columns
          • Achievement Columns
      • Decision Dashboard
        • Understanding the Report
        • Interpreting the Data
      • Accountability Value Added
  • Additional Resources
    • Understanding EVAAS
    • Using EVAAS
    • Success Stories
    • Publications
    • Reporting FAQs
  • General Help
    • Accessibility
    • Configuring Email
    • Printing
    • Supported Browsers

School Diagnostic

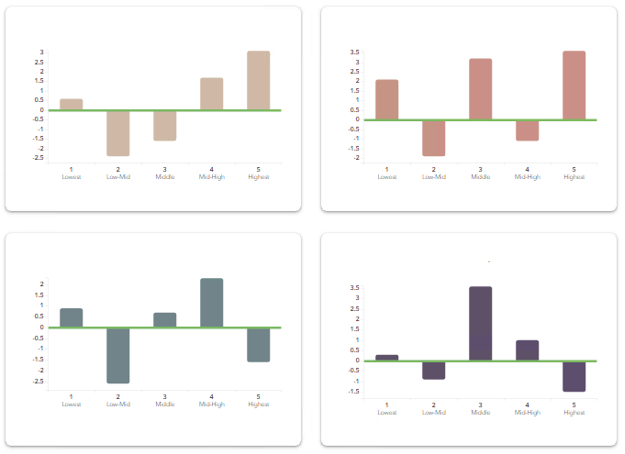
While School Value-Added reports provide reliable measures of average student growth for the group of students served, the School Diagnostic reports offer important information about the growth of groups of students at different achievement levels. These reports can help you reflect on how your instructional programs are supporting the academic growth of all students.

For information on how students are placed into and excluded from achievement groups, see Technical Details.

Copyright © 2023 SAS Institute Inc., Cary, NC, USA. All Rights Reserved.